Solana Falls 21% as ETF Outflows and Whale Deposits Weigh
2 min read
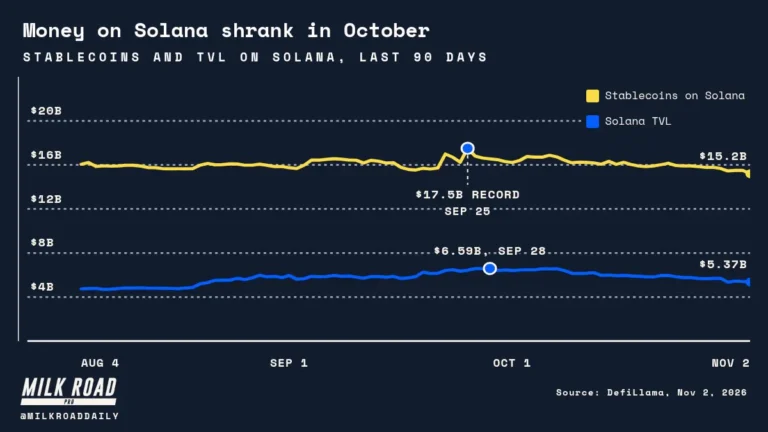
Solana fell to $91.84 on Monday, November 2, after losing approximately 21% over 30 days and breaking below $96 support, according to CoinGecko. The decline coincided with institutional fund withdrawals and large transfers to cryptocurrency exchanges.
The Solana mainnet remains operational.
U.S.-listed spot Solana exchange-traded funds recorded $71.47 million in net outflows during the week ending October 30, according to fund-flow figures. It was their largest reported weekly withdrawal since launch and marked a fourth consecutive week of negative flows.
The withdrawals suggest weakening demand through regulated investment products during a period of falling prices. However, fund redemptions and cryptocurrency price movements do not establish a direct causal relationship.

Whale Transfers Add Market Pressure
On-chain records described in the reporting show an unidentified large holder depositing 1.49 million SOL, valued at approximately $148.77 million, across Binance, Coinbase and Kraken over 10 days.
The exchange deposits coincided with reported asset swaps linked to the Binance exploit. Deposits alone do not establish that the transferred SOL was sold.
The decline coincided with weaker network fee revenue and fewer unique active transaction-signing identities, although the available figures do not establish a direct causal relationship.
Technical Levels and Investor Risks
The stated immediate resistance zone lies between $95.50 and $98.08, around the reported 200-day exponential moving average area.
Digital assets carry substantial price and smart-contract risks. SOL holdings are not protected by FDIC deposit insurance or Germany’s EinSiG deposit-guarantee framework.
What to Watch Next
A sustained recovery above the stated resistance zone would provide an initial indication of improving price momentum. Further selling could put the $77.00 to $78.35 structural support range in focus. The next weekly ETF flow figures will show whether institutional withdrawals are continuing or easing.
Live Solana chart
Data: CoinGecko. Prices in USD.