Solana Falls 6.7% as XRP Maintains $22 Billion Market Value Lead
17 min read
Solana fell 6.7% to $93.78 on October 30, 2026, according to CryptoTicker, which valued the token at $55.33 billion. Separately, 24/7 Wall St. estimated that SOL needed to gain 38.6% from its earlier price snapshot to match XRP’s market value.
Key Takeaways
- Solana’s October decline widened the challenge of overtaking XRP by market capitalisation before December 31, 2026.
- OKX futures data showed 3.38 accounts holding long positions for every account holding a short position, indicating heavily bullish positioning despite falling prices.
- Solana spot ETFs experienced declining cumulative net inflows, while XRP funds recorded positive net investment flows.
- Ripple’s national trust bank approval and Solana’s payment infrastructure launches created contrasting institutional developments.
- The two cryptocurrencies’ different circulating supplies mean that spot-price movements alone cannot determine which asset will have the larger valuation.
Solana Price Drops Below $100
Solana’s latest decline was sharper than the losses recorded by the two largest cryptocurrencies. Bitcoin fell 4.9% to $76,670, while Ethereum declined 4.2% to $2,228, according to CryptoTicker’s October 30 market assessment.
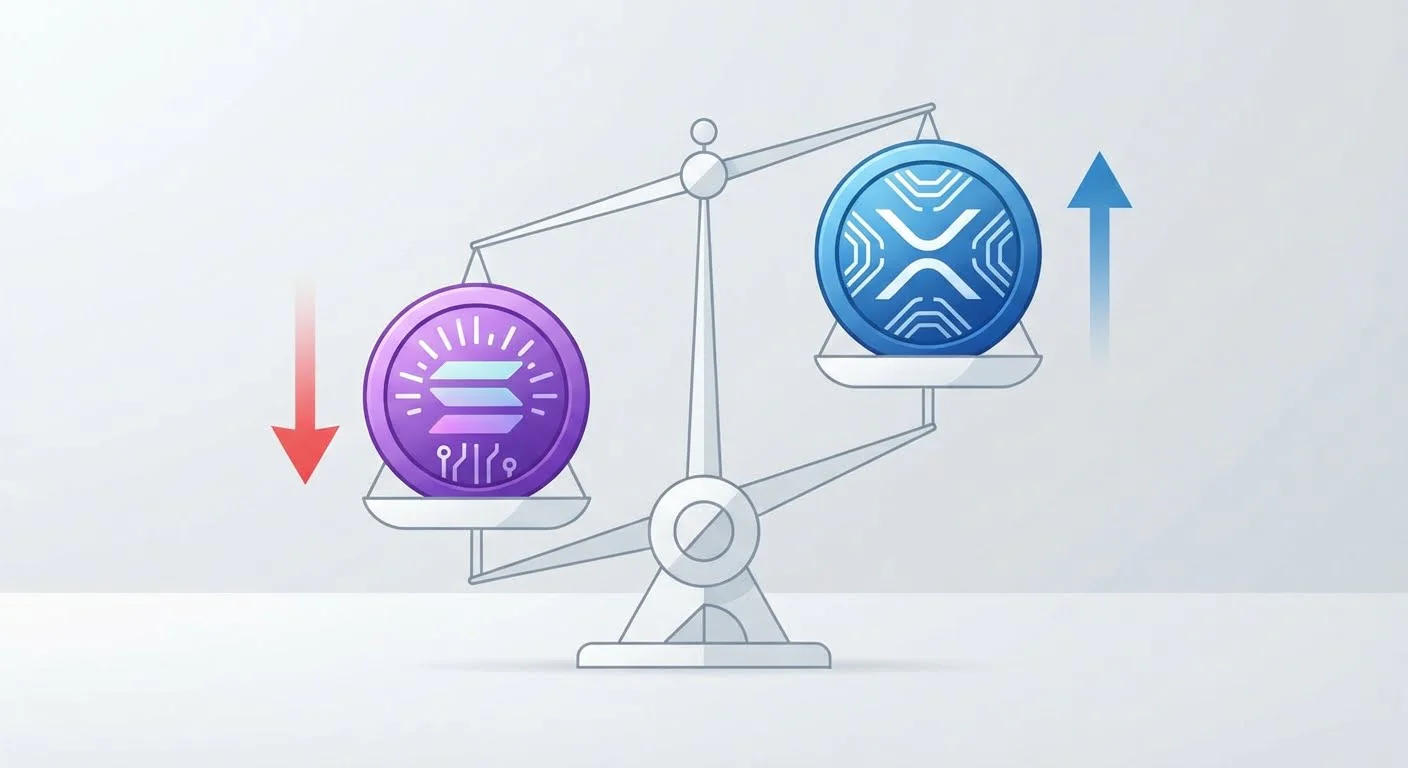
The difference placed additional pressure on Solana’s attempt to narrow its valuation gap with XRP. Both assets had weakened during October, but SOL’s steeper monthly decline left it further from the price levels required to challenge XRP’s market capitalisation.
Solana traded between $92.64 and $100.55 over the 24-hour reporting period. CryptoTicker described the approximately 8.5% trading range as one of the widest recorded for SOL during the month.
The outlet reported that approximately $5.9 billion worth of Solana changed hands during the period, citing CoinGecko trading data. The activity accompanied a decline that brought the cryptocurrency close to its intraday low.
The $100 threshold had been a closely monitored price level since October 22. CryptoTicker reported that SOL fell below it on Thursday evening and did not recover it during Friday’s trading.
Thursday’s reference price was $100.29, according to the outlet’s earlier assessment. By Friday evening, SOL had moved substantially below that level, weakening its short-term price structure.
The decline followed several weeks of losses. According to 24/7 Wall St., Solana reached $121.52 on October 4 before falling to approximately $95 on October 29.
For the month, the financial publication recorded a 19.5% decline for SOL, compared with a 17.6% fall for XRP. The comparison helps explain why XRP retained its larger valuation despite experiencing its own substantial price weakness.
XRP Retains Market Capitalisation Lead
A separate comparison published by MarketCapOf placed XRP’s market capitalisation at approximately $79.22 billion, compared with $56.30 billion for Solana.
The difference amounted to about $22.92 billion in the provider’s October 30 data snapshot.
MarketCapOf displayed a SOL price of $95.39 and an XRP price of $1.25. These figures represent a different market observation from CryptoTicker’s later Friday evening assessment.
MarketCapOf displayed a theoretical SOL price of approximately $134.23 at XRP’s market capitalisation. However, the provider’s displayed price, supply and valuation figures do not fully reconcile, so the figure should be treated as an indicative comparison rather than a precisely verified price threshold.
Using the two reported market capitalisations directly, XRP’s valuation was approximately 1.41 times Solana’s. That relationship illustrates the scale of the difference between the assets without assuming their market prices remained unchanged after the observation.
The provider also examined the reverse scenario, in which XRP’s valuation would decline to match Solana’s.
MarketCapOf calculated an indicative XRP price of $0.8883, equivalent to a decline of approximately 28.94% from the quoted $1.25 price.
The model assumes the comparison can be made using the provider’s stated supply and valuation inputs. Because those inputs are not fully consistent, the projected token prices should not be interpreted as exact thresholds.
For a definitive market capitalisation comparison, both cryptocurrencies must be measured using prices and circulating supplies from the same observation period.
Source: MarketCapOf, October 30, 2026. The circulating-supply figures are reproduced from the provider’s comparison.
Its displayed spot prices and market capitalisations are omitted because they do not fully reconcile mathematically.
Historical Valuation Gap Changes During 2026
The difference between Solana and XRP has fluctuated considerably over the past year.
On October 2, 2025, Solana closed at $235, with a market capitalisation of approximately $127.6 billion, according to 24/7 Wall St. XRP’s valuation at the time was approximately $181.9 billion.
Solana therefore remained behind XRP even when its individual token price was substantially higher than its late-October 2026 level.
The relationship continued to change throughout 2026 as both assets experienced price movements and changes in circulating valuation.
According to 24/7 Wall St., the appreciation required for Solana to match XRP’s market capitalisation reached 96.5% on February 12 before narrowing to 30.9% on October 7.
The movement between those observations provides a historical timeline of how the relative valuation gap changed during the year.
An intermediate assessment by Sam Daodu, published through Yahoo Finance on October 15, placed the relative gap at approximately 37.3%.
That report compared Solana at roughly $102, with a market capitalisation near $60.2 billion, against an XRP valuation of approximately $82.6 billion.
The October 15 figures represent a historical observation rather than a current market quotation. They provide an additional reference point between the earlier October valuation comparison and the October 30 reports.
24/7 Wall St. also identified January 18, 2026, as the most recent session when Solana closed above $134, finishing that day at approximately $136.
The financial publication’s historical analysis therefore places the roughly $134 valuation scenario within Solana’s previous trading range, rather than beyond every price reached during 2026.
Its assessment also indicates that Solana has not overtaken XRP by market capitalisation since at least September 2025.
The historical record is relevant because Solana’s attempt to overtake XRP depends on the relationship between both assets, not merely whether SOL can recover a particular earlier price.
Different Token Supplies Affect Valuations
The comparison is complicated by the different supply arrangements governing SOL and XRP.
XRP has a fixed maximum supply of 100 billion tokens, while Solana operates without a fixed upper limit.
Solana issues additional tokens through its network’s staking arrangements. As circulating supply increases, the same individual token price can represent a larger total market capitalisation.
24/7 Wall St. illustrated this effect using historical Solana figures from two points during 2026.
On January 1, SOL closed at $127, giving it a market capitalisation of approximately $68.9 billion.
By September 30, the token’s closing price had fallen to $118, but its reported market capitalisation had increased slightly to $69.4 billion.
The two observations show why a decline in individual token price does not necessarily produce an equivalent decline in total valuation when circulating supply changes.
Additional issuance can also affect existing investors because their holdings represent a changing proportion of the circulating token supply.
For the XRP Ledger, the maximum number of XRP tokens is capped, although circulating supply can still change as previously issued tokens become available.
24/7 Wall St. reported approximately 63.4 billion XRP circulating in its assessment, compared with the lower figure presented by MarketCapOf’s separate dataset.
The financial publication also estimated XRP’s fully diluted valuation at approximately $124.7 billion, against $61.5 billion for Solana.
The fully diluted figures use different supply assumptions from circulating market capitalisation, so they provide another comparison rather than a replacement for the spot-market valuations.
The supply difference helps explain how the price Solana needs to match XRP’s valuation can change over time.
For example, 24/7 Wall St. reported that Solana would have needed a token price of approximately $147 in January to match an XRP market value of $79.6 billion.
That historical estimate was higher than the publication’s late-October scenario, reflecting the changing relationship between prices, supply and market capitalisation over the intervening months.
Futures Market Shows Bullish Imbalance
Solana’s price decline coincided with increasingly uneven positioning in the futures market.
CryptoTicker examined publicly available statistics from the OKX exchange across October 17 to October 30, 2026, covering long and short account ratios, turnover and open interest.
The analysis found that accounts holding long positions substantially outnumbered those holding short positions.
On October 18, the long-to-short account ratio stood at 2.24. By October 30, it had reached 3.38, the highest reading within the two-week observation period.
The change developed over several sessions rather than occurring in a single sudden move.
CryptoTicker recorded intermediate ratio readings of 2.57, 2.96, 3.18, 3.21 and 3.37 as positioning became increasingly concentrated on the long side.
The result was that approximately three-quarters of the measured futures accounts were positioned for a rise in SOL.
The metric describes account positioning rather than the total value of contracts held by buyers and sellers.
An account holding a small long position receives the same account-level classification as one holding substantially more exposure. Consequently, the ratio does not establish the proportion of futures capital invested on either side.
CryptoTicker’s analyst Alexander Schmidt interpreted the imbalance as a potential source of additional downside pressure if falling prices forced leveraged traders to close positions.
That assessment is conditional on subsequent price changes and the leverage held by market participants. The ratio alone does not demonstrate that a liquidation cascade has occurred.
Trading Turnover Rises Sharply
CryptoTicker also recorded a substantial increase in trading activity across Solana futures contracts.
Turnover reached $2.127 billion on October 30, compared with $959 million on Thursday and $634 million on Wednesday.
The increase indicated that traders were executing substantially more contracts during the period of heightened price volatility.
Open interest, however, changed comparatively little.
The value of outstanding futures contracts declined from $377 million to approximately $371 million during the observation period.
CryptoTicker interpreted the combination of higher turnover and relatively stable open interest as evidence of position turnover rather than a broad reduction in futures exposure. The aggregate figures do not identify individual traders or establish which positions were liquidated.
The publication’s assessment suggested that substantial trading activity was occurring while the overall amount of outstanding futures exposure remained comparatively stable.
Aggressive order activity provided another indication of the direction of trading.
The report recorded $1.096 billion in aggressive buy orders, against approximately $997 million in aggressive sell orders on Friday.
That represented roughly $1.10 in aggressive buying for every dollar in aggressive selling, according to CryptoTicker.
The presence of stronger aggressive buying during a falling market indicated that traders continued attempting to establish positions despite the decline in SOL’s spot price.
It did not establish that buyers had gained sufficient control to reverse the market’s direction.
Funding Rates Add Trading Costs
The futures market’s funding rate provided a further signal of the imbalance between long and short positioning.
CryptoTicker reported a positive funding rate of 0.0025% per settlement period on Friday evening.
The positive reading indicated that traders holding long perpetual futures positions were paying funding to traders holding short positions.
For investors using leverage, those ongoing payments added to the cost of maintaining bullish positions while the underlying token declined.
CryptoTicker considered the combination of concentrated long accounts, elevated turnover and positive funding rates a risk factor for further price weakness.
The outlet also examined the possibility of forced liquidations if SOL continued declining through the lower end of its recent trading range.
Those outcomes remained scenarios based on observed positioning, rather than confirmed future events.
The publication identified $92.64 as the immediate downside reference from Friday’s intraday trading.
Below that level, its analysis pointed to the $90 area as another potential reference, while a recovery above the broken $100 threshold would change the short-term technical picture.
CryptoTicker also identified a $100.34 to $102.74 range associated with trading between October 24 and October 29.
That earlier trading area was relevant because prices subsequently moved below it, leaving the range above Friday’s market level.
These levels describe the trading structure observed during the reporting period. They do not guarantee that buying or selling pressure will emerge at any particular price.
On-Chain Capital Reflects Price Decline
Beyond futures trading, CryptoTicker examined changes in the value of assets held within Solana applications.
The outlet reported that on-chain application capital declined from approximately $5.70 billion on Thursday to $5.32 billion on Friday.
The reduction was approximately 6.5%, broadly matching Solana’s price decline during the same period.
CryptoTicker interpreted that similarity as evidence that the fall in the dollar value of assets held in applications was largely attributable to market valuation changes rather than additional capital withdrawals.
That interpretation offers a different perspective from the futures positioning data.
Where derivatives statistics showed traders increasing their concentration in long accounts, the on-chain figures suggested that lower asset prices accounted for much of the measured decline in application value.
The distinction matters because a fall in dollar-denominated assets held within a network does not necessarily mean an equivalent quantity of cryptocurrency was withdrawn.
It also limits what can be concluded from the reported decline without separating token quantities from their changing market prices.
Solana ETFs Record Net Withdrawals
Investment fund flows presented another challenge for Solana.
According to 24/7 Wall St., citing SoSoValue, Solana spot ETFs recorded $28 million in net outflows on October 29.
That marked the fourth consecutive trading session in which withdrawals exceeded new investment.
The broader measured period also showed weakness in cumulative net flows.
Solana spot ETF cumulative net inflows declined from $1.61 billion on September 30 to approximately $1.48 billion by October 29.
The reduction amounted to $130 million over the period examined by the financial publication.
24/7 Wall St. reported that only two trading sessions during that interval recorded positive net flows.
The stronger of those inflow sessions occurred on October 2, when approximately $1.3 million entered Solana funds.
The reported withdrawal figures measure investment flows, not changes in the total market value of ETF holdings.
That distinction prevents changes caused by cryptocurrency price movements from being confused with investment activity.
The withdrawal pattern contrasted with flows into XRP exchange-traded investment products.
XRP spot ETFs recorded $8 million in net inflows on October 29, according to 24/7 Wall St.’s assessment.
Their cumulative net inflows rose from approximately $1.79 billion at the end of September to $1.81 billion.
The contrasting flows provide a measurable indication of investor activity, although neither fund group’s recent performance establishes a future price direction.
For Solana, the figures showed that investment products had not provided sustained positive net demand during the measured period.
For XRP, the reported flows indicated that investors continued adding capital through the corresponding products despite weakness in the cryptocurrency’s spot price.
Solana Leads XRP In DeFi
Solana’s smaller token market capitalisation contrasted with its stronger position across several decentralised finance indicators.
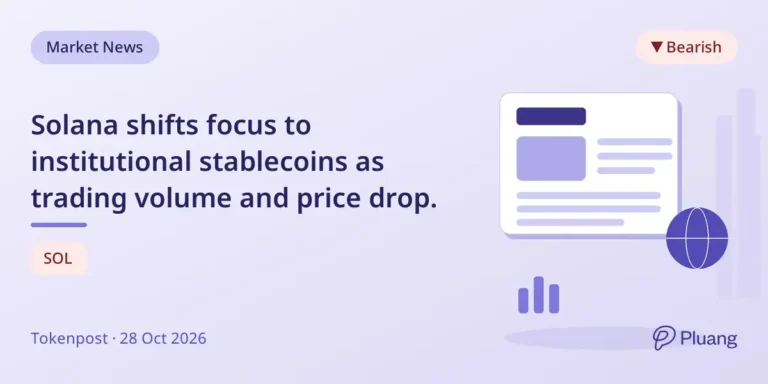
A report carried by Pluang on October 26, citing TokenPost, compared activity across the Solana network and the XRP Ledger.
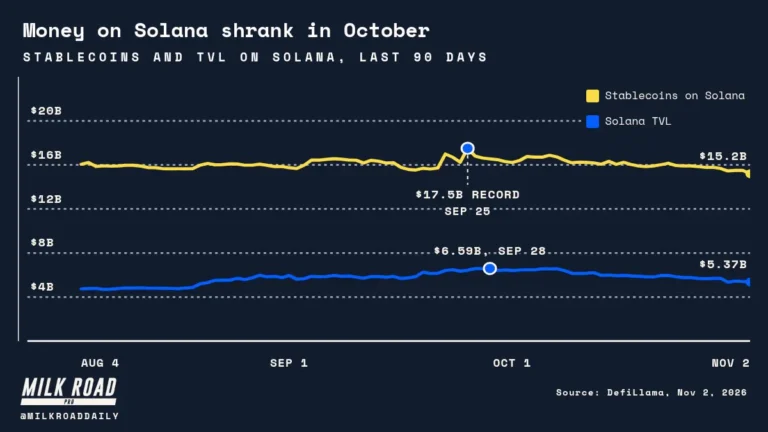
The figures placed Solana’s total value locked at approximately $5.688 billion, compared with $42.23 million on the XRP Ledger.
The comparison showed that substantially more dollar-denominated value was held in the decentralised finance applications captured by the Solana figures.
The difference extended to stablecoin market capitalisation.
Solana recorded approximately $15.601 billion in stablecoins, against $1.235 billion on the XRP Ledger.
The two networks also displayed a wide difference in decentralised exchange trading activity.
Solana recorded approximately $1.304 billion in 24-hour DEX volume, while the XRP Ledger recorded $5.31 million.
Solana’s lead in these on-chain measures contrasts with XRP’s larger circulating token valuation, illustrating that network activity and token market value can move independently.
The figures are particularly relevant because they provide a counterpoint to the investment fund and spot-market performance comparisons.
Solana retained a much larger decentralised finance footprint in the cited measurements even as its native token traded at a lower aggregate valuation than XRP.
The October 26 reporting also provided a separate earlier comparison of the two assets.
On October 24, XRP’s market capitalisation was approximately $81.68 billion, compared with $60.59 billion for Solana, according to the report.
That observation preceded the later October 30 market assessments and provides another dated reference in the changing valuation relationship.
The on-chain figures do not establish that either cryptocurrency will outperform the other. They show that different measures of network use and investor valuation can produce substantially different rankings.
Ripple Expands Cross-Border Payments
The XRP Ledger’s institutional payment ecosystem also recorded a commercial development during October.
Pluang’s October 26 report described a partnership between Ripple and financial technology provider Arf involving settlement liquidity for cross-border payment firms.
The arrangement uses Ripple’s RLUSD stablecoin to support payment settlement activity through the XRP Ledger.
The report also referred to plans for future native lending arrangements on the network, subject to protocol changes.
The partnership provides a specific example of Ripple’s institutional payment focus, which differs from the decentralised finance activity highlighted in the Solana comparison.
Because the proposed lending arrangements depend on future protocol developments, they should not be presented as already operational.
The integration also should not be equated with an automatic increase in demand for XRP, which remains a distinct digital asset from the RLUSD stablecoin.
Polygon Expands Solana Payment Access
Solana’s ecosystem also experienced new payment infrastructure developments during the final week of October.
According to 24/7 Wall St., Polygon Labs added Solana to its Open Money Stack on October 29.
The integration enables businesses to receive deposits through banks, payment cards or cryptocurrencies and send payments using supported stablecoins.
The assets identified in the report include USDC, USDT and PYUSD.
The development expanded Solana’s connectivity with payment services intended for businesses using digital assets.
24/7 Wall St. also cited Solana Foundation spokesperson Jamal Raees, who reported that the network had processed more than $5.7 trillion in stablecoin transfers during 2026.
That figure describes cumulative transaction activity rather than the amount of stablecoin capital held on the network at one time.
It therefore measures a different aspect of payment use from the stablecoin market capitalisation reported in the earlier decentralised finance comparison.
The integration expands Solana’s payment connectivity, but its effect on SOL demand has not been established by the announcement.
Its relevance to the XRP comparison lies in the two networks’ continuing efforts to attract payment and settlement activity through different financial infrastructure arrangements.
Ondo Expands Tokenised Investment Products
Solana also recorded a development involving tokenised investment strategies.
24/7 Wall St. reported that Ondo Finance launched its Intelligent Portfolios on Solana on October 29, 2026, following an initial launch on September 24.
The products consisted of tokenised model portfolios, including three strategies tracking BlackRock investment approaches.
The launch added another traditional-finance-linked product category to Solana’s network.
However, the commercial announcement did not coincide with a recovery in the SOL price during the reported trading period.
24/7 Wall St. recorded Solana closing at approximately $95 on October 29, compared with $102 the previous day.
That observation does not demonstrate that the announcement caused or contributed to the decline.
The launch therefore adds to Solana’s financial-product ecosystem without providing evidence of an immediate price benefit.
In the context of the market capitalisation comparison, the Ondo development represents progress in the range of products available on Solana rather than a measurable reversal in investor valuation.
Ripple Gains National Trust Bank Approval
Ripple’s institutional developments included a significant regulatory milestone.
The company received final approval from the US Office of the Comptroller of the Currency for Ripple National Trust Bank on October 28, 2026, according to 24/7 Wall St.
The approval allows the national trust bank to provide digital-asset custody services and manage reserves associated with Ripple’s RLUSD stablecoin.
The financial publication reported that RLUSD was available through platforms including Robinhood, Chain and Bitstamp.
The authorisation represents a regulated institutional capability within Ripple’s broader digital-asset business.
It differs from Solana’s payment integrations and tokenisation launches because it concerns the legal authority under which Ripple can provide specified financial services.
The approval strengthens Ripple’s regulated custody and stablecoin operations, although its direct effect on XRP demand remains unestablished.
It gives Ripple a concrete institutional development alongside XRP’s stronger ETF inflows during the measured period.
The timing was also relevant to the broader comparison because the approval arrived during the same final week of October in which Solana’s price and investment flows remained under pressure.
Year-End Market Outlook
24/7 Wall St. assessed Solana’s chances of overtaking XRP by December 31, 2026, as unlikely under the market conditions described in its October 30 analysis.
The publication identified Solana’s 50-day average closing price at approximately $109 as one potential recovery reference, while its 200-day average stood near $89.
It also pointed to XRP’s one-year low of $0.99, recorded on August 16, as an important consideration in any scenario involving a substantial XRP decline.
The next significant milestone is whether Solana can recover enough ground before December 1 to challenge the higher valuation levels examined in the report.
The decisive year-end comparison will depend on the circulating market capitalisation of both cryptocurrencies, rather than the performance of SOL alone.
Key Market Comparisons
| Metric | Solana | XRP |
|---|---|---|
| Circulating supply | 581.31 million SOL | 62.53 billion XRP |
| Maximum supply | No fixed maximum | 100 billion XRP |
| Token issuance | Continuing issuance | Fixed maximum supply |
| Main comparison | Expanding circulating supply | Capped total token supply |
Live Solana chart
Data: CoinGecko. Prices in USD.