
Ethereum Tests $2,165-$2,321 Support Band as Analysts Diverge
2 min read
Ethereum is testing a $2,165 to $2,321 support band, according to cryptocurrency analyst CryptoGoos, who expects a potential recovery towards $3,000. However, another analyst has warned that weakness below a key resistance level could trigger further losses.
According to ZyCrypto, CryptoGoos shared an ETH/USDT chart on 26 October 2026, identifying the bull market support band as a possible area for Ethereum to establish a local bottom following its recent pullback.
Ethereum Support Band Signals Potential Recovery
CryptoGoos highlighted Ethereum’s approach towards the upper boundary of the support zone on Binance’s daily chart. The analysis follows an earlier recovery, a sharp rally and subsequent consolidation that brought prices back towards the rising technical band.
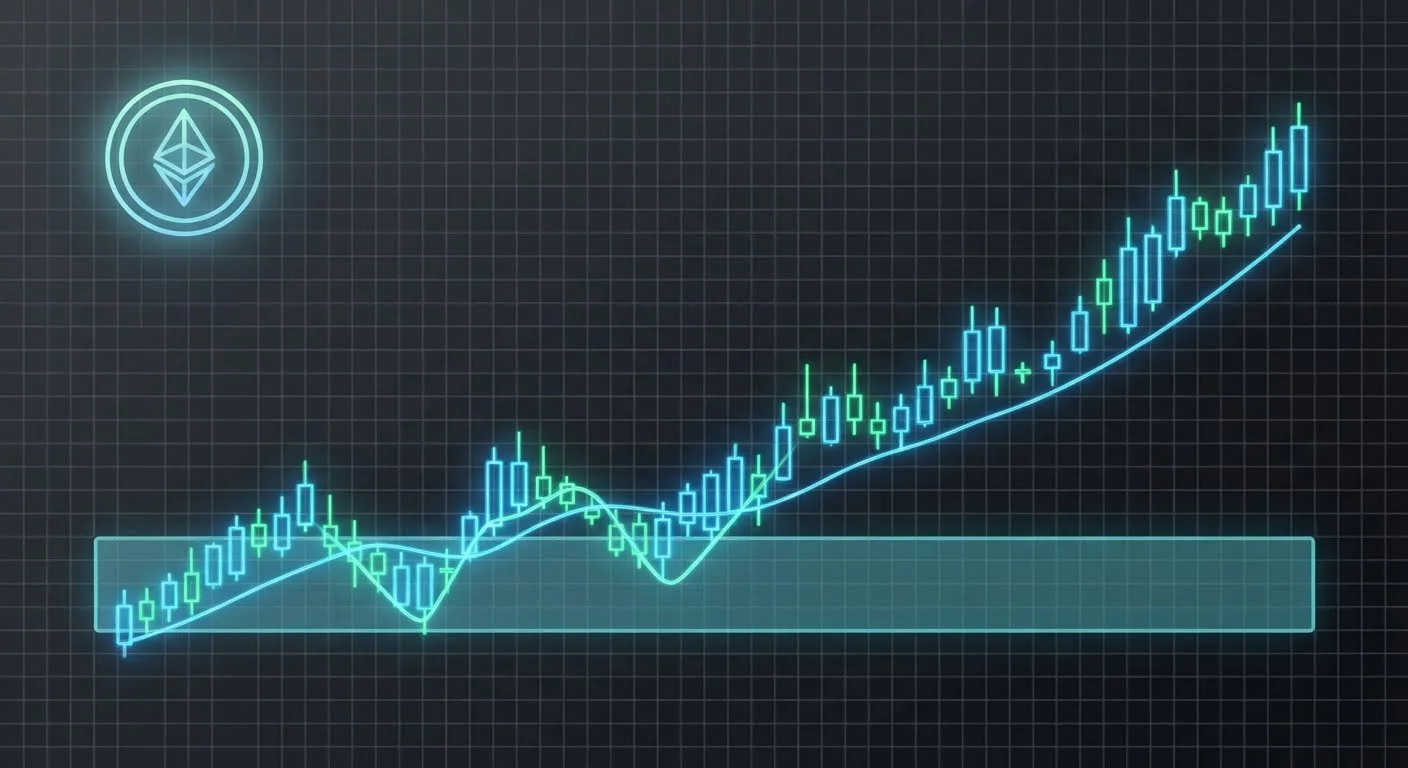
The analyst described the potential turning point:
“Somewhere in this band the local bottom will happen.”
CryptoGoos subsequently identified $3,000 as the next target, conditional on Ethereum establishing support. The forecast represents a technical scenario rather than confirmation that the cryptocurrency has completed its correction.
Analyst Warns of Further Downside
Analyst Ted offered a contrasting assessment, pointing to Ethereum’s failure to recover important weekly price levels.
Ted observed that ETH had closed another weekly candle below $2,400, indicating continued weakness despite attempts to stabilise.
“It’s now below $2,350, and if Ethereum fails to reclaim it soon, a drop to $2,200 could happen next.”
Ted’s chart also identified resistance around $2,800 and higher, suggesting that Ethereum could encounter additional selling pressure even if it recovers from its immediate weakness.
The competing forecasts place particular importance on whether buyers can defend the lower support region or whether continued selling pushes ETH towards Ted’s bearish target.
Ethereum Price Performance Shows Mixed Signals
ZyCrypto reported Ethereum trading at approximately $2,315 on 29 October, with its 24-hour trading range extending from roughly $2,292 to $2,361.
The cryptocurrency recorded a daily gain of approximately 0.3% to 0.7%, while its seven-day performance showed a stronger 4.5% increase.
Despite that weekly improvement, ETH remained approximately 11% lower for October and about 53% below its $4,953.73 all-time high, reached on 24 August 2025.
These figures show why the support test matters: a sustained recovery would strengthen the bullish interpretation, while a failure to regain the levels identified by Ted would leave Ethereum exposed to further downside. Neither outcome is established by the charts alone.
Live Ethereum chart
Data: CoinGecko. Prices in USD.