XRP Drops Below Key Moving Averages as Liquidations Rise
2 min read
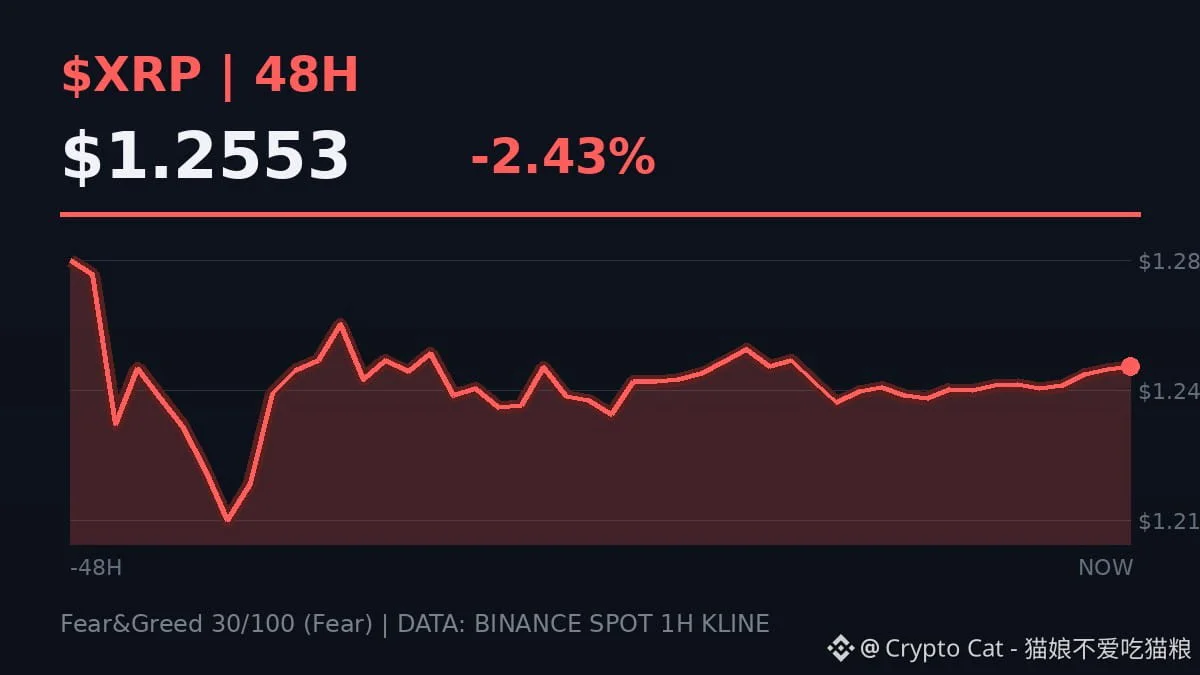
XRP has fallen below several closely watched moving averages, including its 200-day simple moving average of $1.28. The market decline coincided with $37.6 million in derivatives liquidations, highlighting the risks associated with leveraged cryptocurrency trading.
The breakdown signals weakening price momentum across short-term and longer-term indicators. However, technical weakness alone does not establish that XRP has entered a prolonged bear market.

Key XRP Technical Levels
XRP’s technical indicators show weakness across multiple time frames, with its 20-day and 50-day simple moving averages at $1.32 and $1.40, respectively. Both levels now represent potential barriers to a recovery.
The 200-week exponential moving average stands at $1.3715, providing another technical reference point. This longer-term indicator offers a separate perspective on market direction from the daily averages.
Derivatives Liquidations Increase Market Pressure
The reported liquidations demonstrate how leveraged positions can amplify losses during a cryptocurrency sell-off. Automated position closures can add selling pressure when market prices decline.
Such liquidations also expose traders to liquidity risks, particularly during periods of sharp price movements. They do not, however, establish the size of selling by unleveraged investors.
ETF Holdings and Investor Protections
The available figures do not establish the custody arrangements or security status of spot XRP ETF holdings. Nor do they establish the direction or size of October spot XRP ETF asset flows.
Digital assets also lack the statutory cash deposit insurance protections associated with conventional bank deposits, including FDIC coverage in the United States and comparable European deposit-guarantee arrangements.
What Comes Next for XRP
Continued trading around the identified moving averages will help clarify whether XRP can regain its previous technical support levels.
The verified technical levels establish reference points for price movements but do not substantiate a November price forecast. A recovery through those levels would improve the technical picture, while continued weakness would leave the broader trend under pressure.
| Technical Indicator | Reported Level | Significance |
|---|---|---|
| 20-day SMA | $1.32 | Short-term recovery reference |
| 50-day SMA | $1.40 | Intermediate trend reference |
| 200-day SMA | $1.28 | Long-term daily trend boundary |
| 200-week EMA | $1.3715 | Longer-term cyclical reference |
Live XRP chart
Data: CoinGecko. Prices in USD.